Chris Tremblay

LinkedIn
chris.tremblay@microsoft.com
christremblay.com
azurepetstore.com
View my Microsoft Learn Module https://aka.ms/learn-about-containers-on-azure-with-chris
08 - Configure Apps to use Application Insights
This guide is part of the Azure Pet Store App Dev Reference Guide
In this section, we’ll configure Apps to use Application Insights
📝 Please Note, As with the other guides, the code for this is already complete, it just needs to be enabled via application configuration. The objective of this guide is to walk you through the steps needed to enable & configure the Azure services and Pet Store Application code to make this all of this work.
📝 Please Note, We will assume you have forked the azure-cloud repository, it is the easiest way to get going (for instructions on this view the “Forking the azure-cloud” section in 00-setup-your-environment. Also, both PetStoreApp and PetStoreService use a Spring Boot Application properties file named application.yml to drive the functionality/configuration of these applications which is located in src/main/resources/application.yml of both projects. By default, this file has all of the properties that are needed throughout the guides, and by default are commented out. This means that the applications will start automatically without having to configure anything. As you progress through the guides, each guide will inform you of what properties to uncomment and configure within your environment. If you have not already done so, login to your GitHub account, head to https://github.com/chtrembl/azure-cloud, and fork.
Azure Monitor maximizes the availability and performance of your applications and services by delivering a comprehensive solution for collecting, analyzing, and acting on telemetry from your cloud and on-premises environments. It helps you understand how your applications are performing and proactively identifies issues affecting them and the resources they depend on.
Azure Log queries help you to fully leverage the value of the data collected in Azure Monitor Logs. A powerful query language allows you to join data from multiple tables, aggregate large sets of data, and perform complex operations with minimal code. Virtually any question can be answered and analysis performed as long as the supporting data has been collected, and you understand how to construct the right query.
Some features in Azure Monitor such as insights and solutions process log data without exposing you to the underlying queries. To fully leverage other features of Azure Monitor, you should understand how queries are constructed and how you can use them to interactively analyze data in Azure Monitor Logs.
Just a few examples of what you can do with Azure Monitor include:
- Detect and diagnose issues across applications and dependencies with Application Insights.
- Correlate infrastructure issues with Azure Monitor for VMs and Azure Monitor for Containers.
- Drill into your monitoring data with Log Analytics for troubleshooting and deep diagnostics.
- Support operations at scale with smart alerts and automated actions.
- Create visualizations with Azure dashboards and workbooks.
The image below depicts typical a Web Application Insights Telemetry Model. Consumer’s of this Web Application Telemetry (transactions in Azure Monitor) might be interested but not limited to incoming/outgoing requests/responses (and the meta data associated), the various events, metrics and traces that can and will occur during those requests/responses, faults/exceptions that may occur and downstream correlated/dependencies on other applications and services. Where logging provides an overview to a discrete, event-triggered log, tracing encompasses a much wider, continuous view of an application. The goal of tracing is to following a program’s flow and data progression. When a problem does occur, tracing allows you to see how you got there: which function, the function’s duration, parameters passed, and how deep into the function the user could get. In section 4 below (Write Custom Log Queries (Kusto (KQL) for common use cases) we will look at what it takes to capture the flows depicted here.
You should see something similar to the below image:
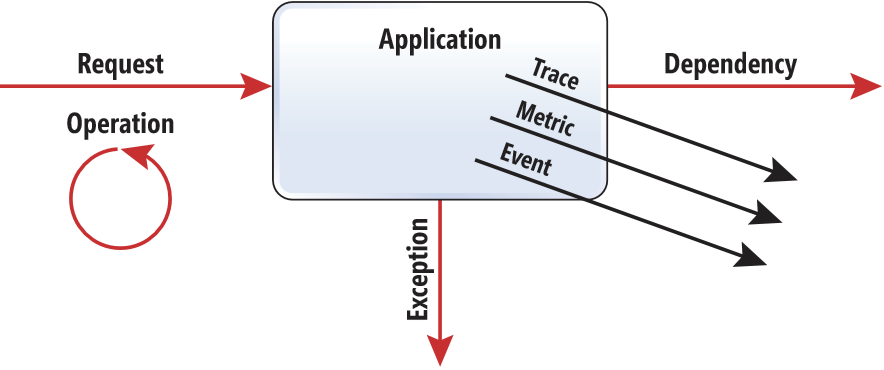
A Web Application/Microservice of this type can/will offer the following types of transactions withing Azure Monitor
- Trace - Diagnostic logs including TrackTrace, log4Net, NLog, and System.Diagnostic.Trace calls.
- Request - HTTP requests received by your server application, including pages, scripts, images, style files, and data. These events are used to create the request and response overview charts.
- Page View - Telemetry sent by the web client, used to create page view reports.
- Custom Event - If you inserted calls to TrackEvent() in order to monitor usage, you can search them here.
- Exception - Uncaught exceptions in the server, and those that you log by using TrackException().
- Dependency - Calls from your server application to other services such as REST APIs or databases, and AJAX calls from your client code.
- Availability - Results of availability tests.
📝 Please Note, the above was taken from Azure Monitor
Guide
In this guide we will look at what it takes to get your Spring Boot Applications (PetStoreApp & PetStore Service) configured to use these Azure Monitor features. We will cover the following:
- 1. Enable/Configure Azure Application Insights
- 2. Enable/Configure Spring Boot Application Code
- 3. View Application Insights > Transaction Search
- 4. Write Custom Log Queries (Kusto (KQL) for common use cases
Before we get started, there are two ways to enable application monitoring for Azure App Services hosted applications (In this tutorial we will be manually instrumenting the application through code):
-
Agent-based application monitoring (ApplicationInsightsAgent).
- This method is the easiest to enable, and no advanced configuration is required. It is often referred to as “runtime” monitoring. For Azure App Services we recommend at a minimum enabling this level of monitoring, and then based on your specific scenario you can evaluate whether more advanced monitoring through manual instrumentation is needed.
-
Manually instrumenting the application through code by installing the Application Insights SDK.
- This approach is much more customizable, but it requires adding a dependency on the Application Insights SDK NuGet packages. This method, also means you have to manage the updates to the latest version of the packages yourself.
- If you need to make custom API calls to track events/dependencies not captured by default with agent-based monitoring, you would need to use this method. Check out the API for custom events and metrics article to learn more. This is also currently the only supported option for Linux based workloads.
📝 Please Note, the above was taken from Enable Application Insights
-
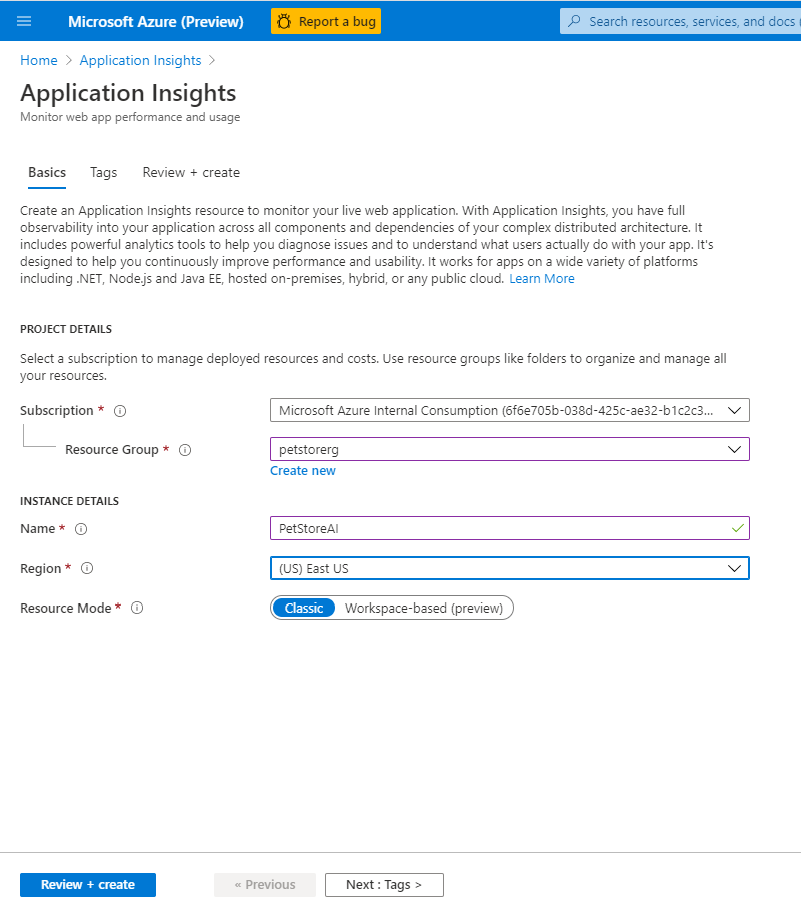
Enable/Configure Azure Application Insights
This gives us an Azure Application Insights Service (Feature of Azure Monitor) to push our data into and access our Telemetry. From the Azure Portal search for Application Insights and create new. This will configure a new instance for us to push data too.
You should see something similar to the below image:
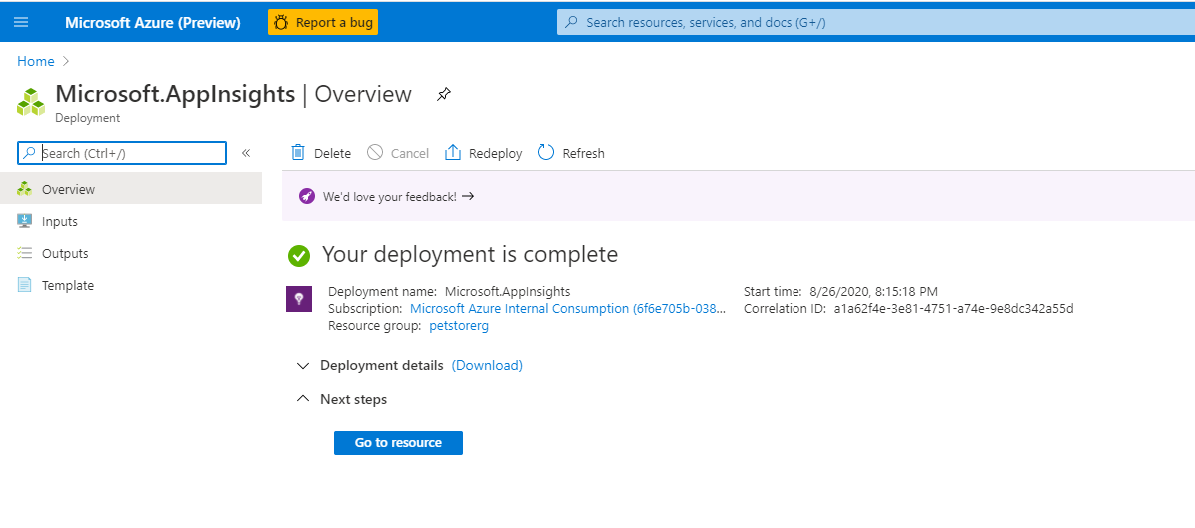
Wait for this to complete …
You should see something similar to the below image:
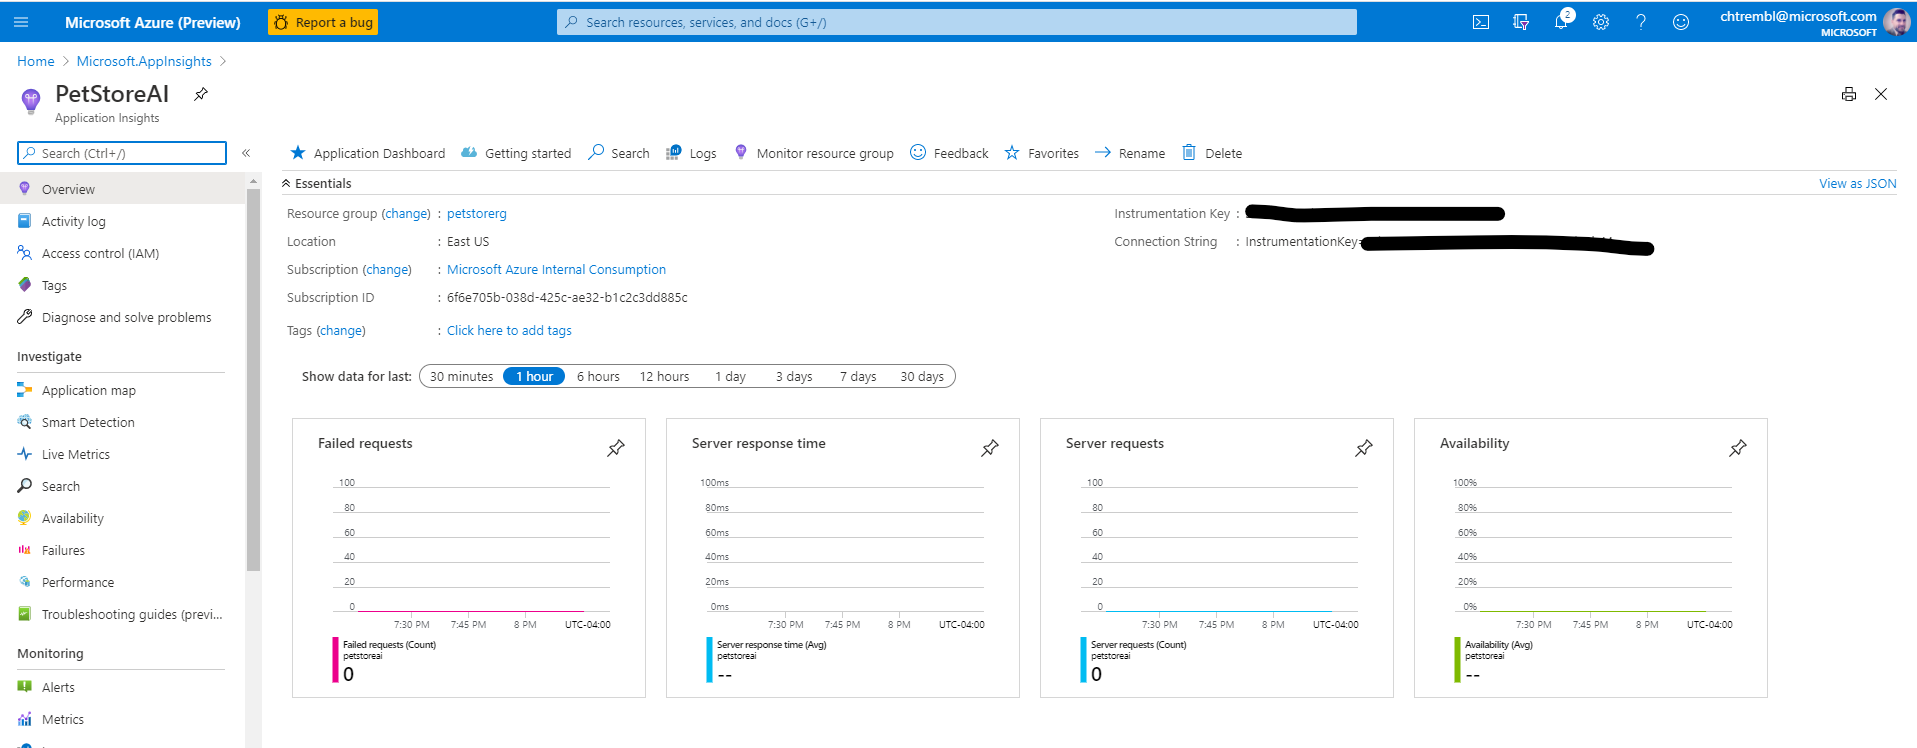
Make note of the Instrumentation Key, it is needed below.
You should see something similar to the below image:
-
Enable/Configure Spring Boot Application Code
Update PetStoreApp src/main/resources/application.yml to uncomment
azure
  application-insights:
      instrumentation-key: ${PETSTOREAPP_AI_INSTRUMENTATION_KEY}
Update PetStorePetService, PetStoreProductService & PetStoreOrderService src/main/resources/application.yml to uncomment
azure
  application-insights:
      instrumentation-key: ${PETSTORESERVICES_AI_INSTRUMENTATION_KEY}
By uncommenting, this tells the Spring Boot Java Runtimes to look for an azure.application-insights.instrumentation-key and if you set then as a container setting, they will get injected at runtime initialization. You can do this across all 4 of the applications. PetStoreApp, PetStorePetService, PetStoreProductService & PetStoreOrderService. All 4 applications will push to the same Application Insights instance for N-Tiered Correlated Telementry.
📝 Please Note, once you uncomment and commit, your GitHub Action and DevOps pipelines should kick off automgacially)
Head to Azure Portal and update Azure App Service Configuration for PetStoreApp (No code change needed and App Container will automagically restart with changes taking effect)
You should see something similar to the below image:

Head to GitHub and view manifests/petstorepetservice-deployment-everything-enabled.yml, manifests/petstoreproductservice-deployment-everything-enabled.yml & manifests/petstoreorderservice-deployment-everything-enabled.yml Remember this is the manifest that tells Azure Kubernetes Cluster our desired state. You’ll notice that PETSTORESERVICES_AI_INSTRUMENTATION_KEY references a secretKeyRef. Since my project is publicly available, I do not want to persist sensitive data in source control. Instead I am persisting the PETSTORESERVICES_AI_INSTRUMENTATION_KEY value in Azure Kubernetes Secrets. (For App Service we store this in App Service Configuration) You have a decision to make, you can source your value right inline with value: “
From the Azure CLI run the following
kubectl create secret generic aisecretkey --from-literal=secret=<your secret here>
This will persist the PETSTORESERVICES_AI_INSTRUMENTATION_KEY into Azure Kubernetes Cluster Secrets and the value will be injected to the container environment at runtime as an environment variable.
You should see something similar to the below image:
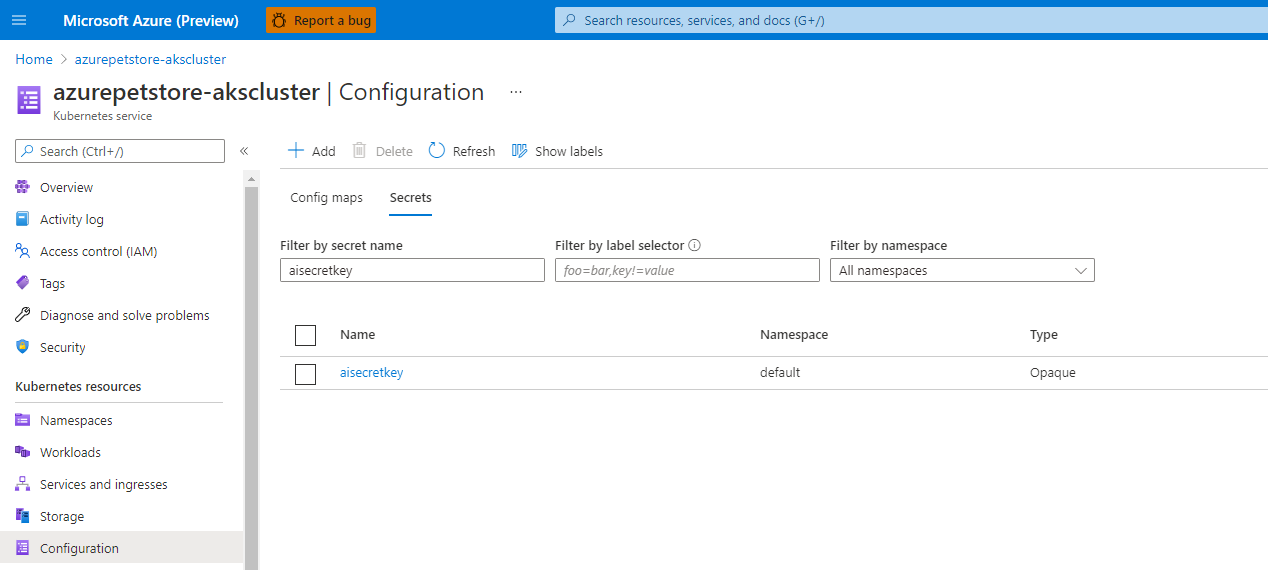
📝 Please Note, if you are using Kubernetes secrets, your manifests deployments should look something like this (will vary based on service)
    - name: PETSTOREPETSERVICE_SERVER_PORT
    value: "80"
    - name: spring.config.name
    value: application_with_everything_enabled
    - name: PETSTORESERVICES_AI_INSTRUMENTATION_KEY
    valueFrom:
        secretKeyRef:
        name: aisecretkey
        key: secret
📝 Please Note, if you are not using Kubernetes secrets, your manifests deployments should look like this
      env:
        - name: PETSTORESERVICES_AI_INSTRUMENTATION_KEY
          value: "<your instrumentation key here>"
Commit these changes and run your Azure DevOps Pipeline
📝 Please Note, At this point your Applications should be pushing data to Application Insights. You can however read below to see how it all works within the PetStoreApp and/or see how to query data.
Add a logback-spring.xml with the following contents which configures an ApplicationInsightsAppender which is responsible for pushing all of your log data into Azure Monitor, automagically for you. These will appear as Trace’s in Azure Monitor.
  <?xml version="1.0" encoding="UTF-8"?>
  <configuration>
  <include  resource="org/springframework/boot/logging/logback/base.xml"/>
  <appender  name="aiAppender"
  class="com.microsoft.applicationinsights.logback.ApplicationInsightsAppender">
  </appender>
  <conversionRule  conversionWord="clr"  converterClass="org.springframework.boot.logging.logback.ColorConverter"  />
  <conversionRule  conversionWord="wex"  converterClass="org.springframework.boot.logging.logback.WhitespaceThrowableProxyConverter"  />
  <conversionRule  conversionWord="wEx"  converterClass="org.springframework.boot.logging.logback.ExtendedWhitespaceThrowableProxyConverter"  />
   <appender name="consoleAppender" class="ch.qos.logback.core.ConsoleAppender">
       <layout class="ch.qos.logback.classic.PatternLayout">
           <Pattern>
               %clr(%d{yyyy-MM-dd HH:mm:ss.SSS}){faint} %clr(%5p) %clr(${PID:- }){magenta} %clr(---){faint} %clr([%15.15t]){faint} %clr(%-40.40logger{39}){cyan} %clr(:){faint} application=PetStoreApp session_Id=%X{session_Id} containerHostName=%X{containerHostName} | %m%n%wEx
           </Pattern>
       </layout>
   </appender>
  <root  level="info">
  <appender-ref  ref="aiAppender"  />
  </root>
  </configuration>
Update your maven pom.xml to pull in the Azure dependencies needed to push log data and API for Custom Application Instrumentation.
  <dependency>
  	<groupId>com.microsoft.azure</groupId>
  	<artifactId>applicationinsights-spring-boot-starter</artifactId>
  	<version>2.6.1</version>
  </dependency>
  <dependency>
  	<groupId>com.microsoft.azure</groupId>
  	<artifactId>applicationinsights-logging-logback</artifactId>
  	<version>2.6.1</version>
  </dependency>
The ApplicationInsightsAppender alone is enough to push some default Spring Boot data such as Page Request Transaction Data and Trace Transaction Data into Azure Monitor, however there is often times a need to capture Custom Events and Exceptions as well. Perhaps you’ll want to tie all of these transactions together with a Session ID or Correlation ID (for multiple services/resources leveraging the Application Insights instance) to get a full user flow for a specific user etc… (As mentioned early on in this document) You can do this with
  import com.microsoft.applicationinsights.TelemetryClient;
  ...
  @Autowired
  private TelemetryClient telemetryClient;
Throughout your application code you can use TelementryClient to push transaction data (Custom Events, Page Views, Exceptions etc..) into Application Insights. Suppose you have a Session Scoped Spring Bean, called User, that is wired throughout your application, You could wire in an instance of TelemetryClient to push data to Application Insights, specific to a session. Using MDC We can log all of these Telemetry Transactions with a sessionId which will be very helpful in constructing our Kusto Log Queries.
  package com.chtrembl.petstoreapp.model;

  import java.io.Serializable;

  import org.springframework.beans.factory.annotation.Autowired;
  import org.springframework.context.annotation.Scope;
  import org.springframework.context.annotation.ScopedProxyMode;
  import org.springframework.stereotype.Component;

  import com.microsoft.applicationinsights.TelemetryClient;

  package com.chtrembl.petstoreapp.model;

   import java.io.Serializable;
   import java.util.List;

   import javax.annotation.PostConstruct;

   import org.springframework.beans.factory.annotation.Autowired;
   import org.springframework.context.annotation.Scope;
   import org.springframework.context.annotation.ScopedProxyMode;
   import org.springframework.stereotype.Component;

   import com.microsoft.applicationinsights.TelemetryClient;

   @Component
   @Scope(value = "session", proxyMode = ScopedProxyMode.TARGET_CLASS)
   @SuppressWarnings("serial")
   public class User implements Serializable {
       private String name = "Guest";
       private String sessionId = null;

       // intentionally avoiding spring cache to ensure service calls are made each
       // time to show Telemetry with APIM requests
       private List<Pet> pets;

       @Autowired(required = false)
       private transient TelemetryClient telemetryClient;

       @PostConstruct
       private void initialize() {
           if (this.telemetryClient == null) {
               this.telemetryClient = new com.chtrembl.petstoreapp.service.TelemetryClient();
           }
       }

       public void setName(String name) {
           this.name = name;
       }

       public String getName() {
           return name;
       }

       public String getSessionId() {
           return sessionId;
       }

       public void setSessionId(String sessionId) {
           this.sessionId = sessionId;
       }

       public TelemetryClient getTelemetryClient() {
           return this.telemetryClient;
       }

       public List<Pet> getPets() {
           return pets;
       }

       public synchronized void setPets(List<Pet> pets) {
           this.pets = pets;
       }
   }
Then when you authenticate a new user
  @Autowired
  private User sessionUser;
  ...
  this.sessionUser.getTelemetryClient().getContext().getSession().setIsNewSession(true);
  this.sessionUser.getTelemetryClient().getContext().getSession().setId(this.sessionUser.getSessionId());
  // Track an Event
  	this.sessionUser.getTelemetryClient()
  				.trackEvent(String.format("PetStoreApp %s logged in, container host: %s",
  						this.sessionUser.getName(), this.containerEnvironment.getContainerHostName()));

  MDC.put("session_Id", this.sessionUser.getSessionId());
And this same model can be used throughout your application’s MVC flow…
  import com.microsoft.applicationinsights.telemetry.PageViewTelemetry;

  ...
  // Track a Page View
  PageViewTelemetry pageViewTelemetry = new PageViewTelemetry();
  pageViewTelemetry.setUrl(new URI(request.getRequestURL().toString()));
  pageViewTelemetry.setName("Account Landing Page");
  this.sessionUser.getTelemetryClient().trackPageView(pageViewTelemetry);

  ...
  // Track an Exception
  this.sessionUser.getTelemetryClient().trackException(new NullPointerException("sample null pointer"));
Then when you make a REST call, pass the session-id downstream so that it can be picked up in the PetStoreService and logged just as we’ve done in the PetStoreApp..
  		List<Pet> pets = this.webClient.get().uri("/v2/pet/findByStatus?status={status}", "available")
  				.header("session-id", this.sessionUser.getSessionId()).accept(MediaType.APPLICATION_JSON)
  				.header("Ocp-Apim-Subscription-Key", this.containerEnvironment.getPetStoreServiceSubscriptionKey())
  				.header("Ocp-Apim-Trace", "true").retrieve()
  				.bodyToMono(new ParameterizedTypeReference<List<Pet>>() {
  				}).block();
- View Application Insights > Transaction Search First you will want to hit your application as a couple of different users (different sessions) to generate Transaction Data in Azure Monitor (you can use the PetStoreApp seen here then head to Azure Portal > Application Insights.
Under Transaction Search in the left navigation you can filter transactions within the last 30 minutes and you will see all of the transactions for the application that you just hit. (You will notice different sessionId’s as well, a nice way, among many, to distinguish between flows)
You should see something similar to the below image:

If you select one, you can view all the transactions associated (end to end) for that request (Remember the illustration from above that depicts the user flow). For example, Login: A request comes in (Request Transaction), it gets tracked (Custom Event Transaction), the request handler mapping determines the view (Page View Transaction) and the routing occurs (Logging Transaction from the Application Insights Appender)
You should see something similar to the below image:

-
Write Custom Log Queries (Kusto (KQL) for common use case Often times it is beneficial to get a transactional flow based on user activity. You can do this by individual transaction types (Requests, Page Views, Traces etc…) or perhaps you want to combine results across various sources. Perhaps you have a correlated id/session id that spans multiple application sources (web application and N micro services) Since our Spring boot application is logging the session id (this is in the PetStoreApp footer) for Traces and Events, we can easily capture this via Kusto Queries.
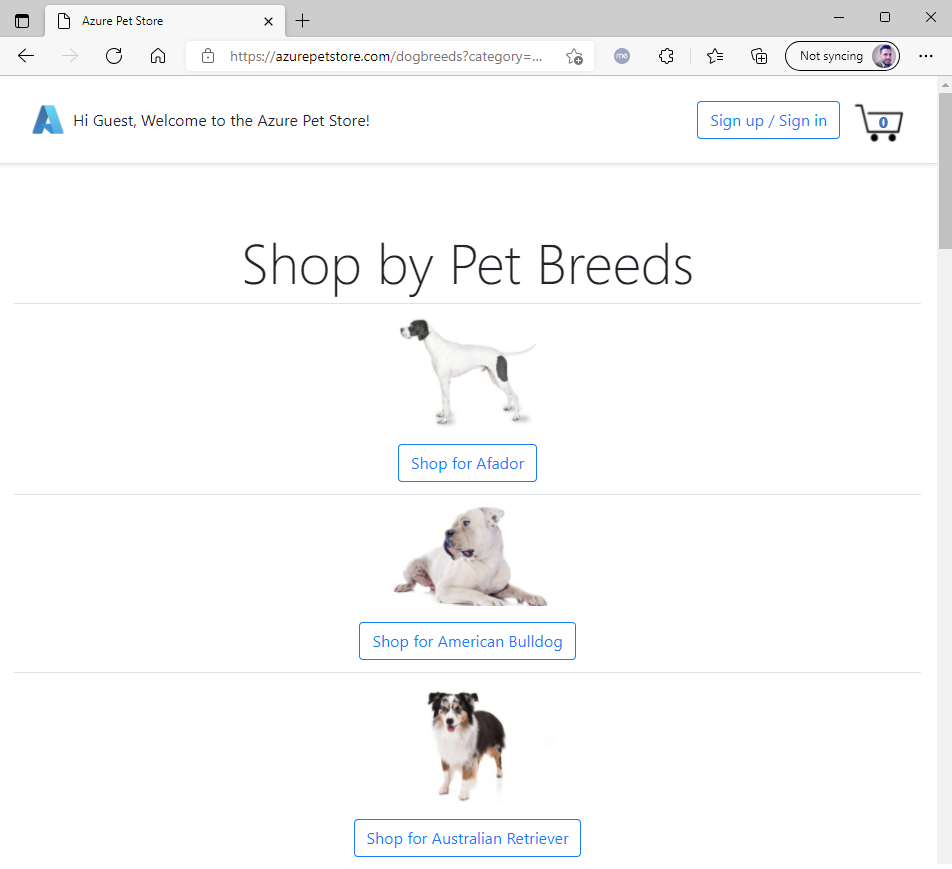
First hit the PetStoreApp and navigate around. There isn’t a whole lot we can do yet because we haven’t enabled B2C, but we can certainly navigate as a Guest user and make a service call for Dog Breeds to the PetStoreService. This session id will be correlated across all of our applications (PetStoreApp and PetStoreService)
You should see something similar to the below image:

Click “Shop by breeds” Breeds
You should see something similar to the below image:
Click on a Dog
You should see something similar to the below image:

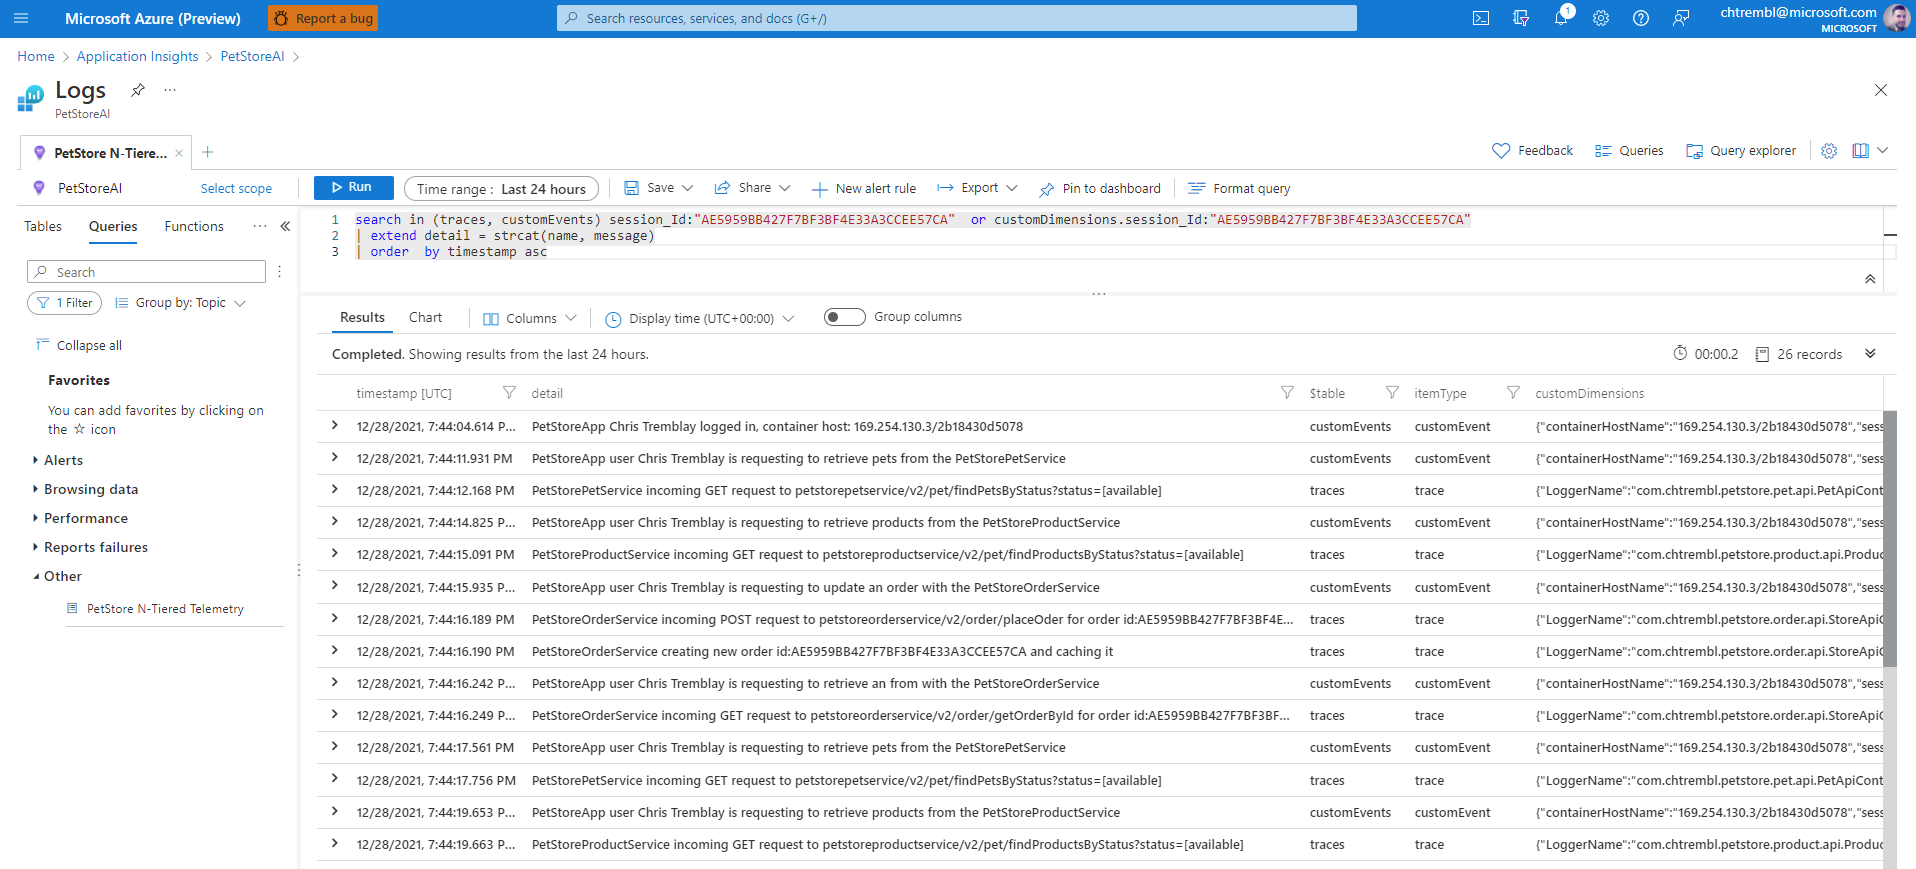
Head to Application Insights > Logs and construct a new query:
Remember use the session_id matching the session value in your footer.
search in (traces, customEvents) session_Id:"27938080E1283EC72FBBFD6100104884"  or customDimensions.session_Id:"27938080E1283EC72FBBFD6100104884"
| extend detail = strcat(name, message)
| order  by timestamp asc
This will query all Trace Data and Custom Event Data where session_Id matches (Put your session_Id in and remember we used MDC attribute to log all of our Transactions with session_Id to ensure Azure Monitor would index accordingly). We are searching the Trace table (all of our Spring Boot Application Logs, as well as Custom Events, which remember is the TelemetryClient that we are programmatically working with). When we log session_Id as Trace from our Application Logs, it appears as customDimension Data (Azure doesn’t know about it) So we need to explicitly extract it. We are also creating a new result field called “detail” which will either map to the Application Log message or the TelemetryClient message. This makes readability much cleaner having it in one column. Now Execute the query and you will see an Ascending display of data detailing what the user for this JSESSION ID did during their time on the Application. (What paths they took, exceptions that occurred etc…) You can also use an ID that spans N Application/Microservices. This is just scratching the surface what you can do with Kusto.
You will see the PetStoreApp and PetStoreService (N-Tier Correlated Telemetry) for this user experience above (Navigating around)
You should see something similar to the below image:
Things you can now do now with this guide
☑️ Kubernetes Secrets
☑️ N-Tier Correlated Telementry with Application Insights using Kusto Query Language
➡️ Next guide: 09 - Configure API Management in front of PetStoreService